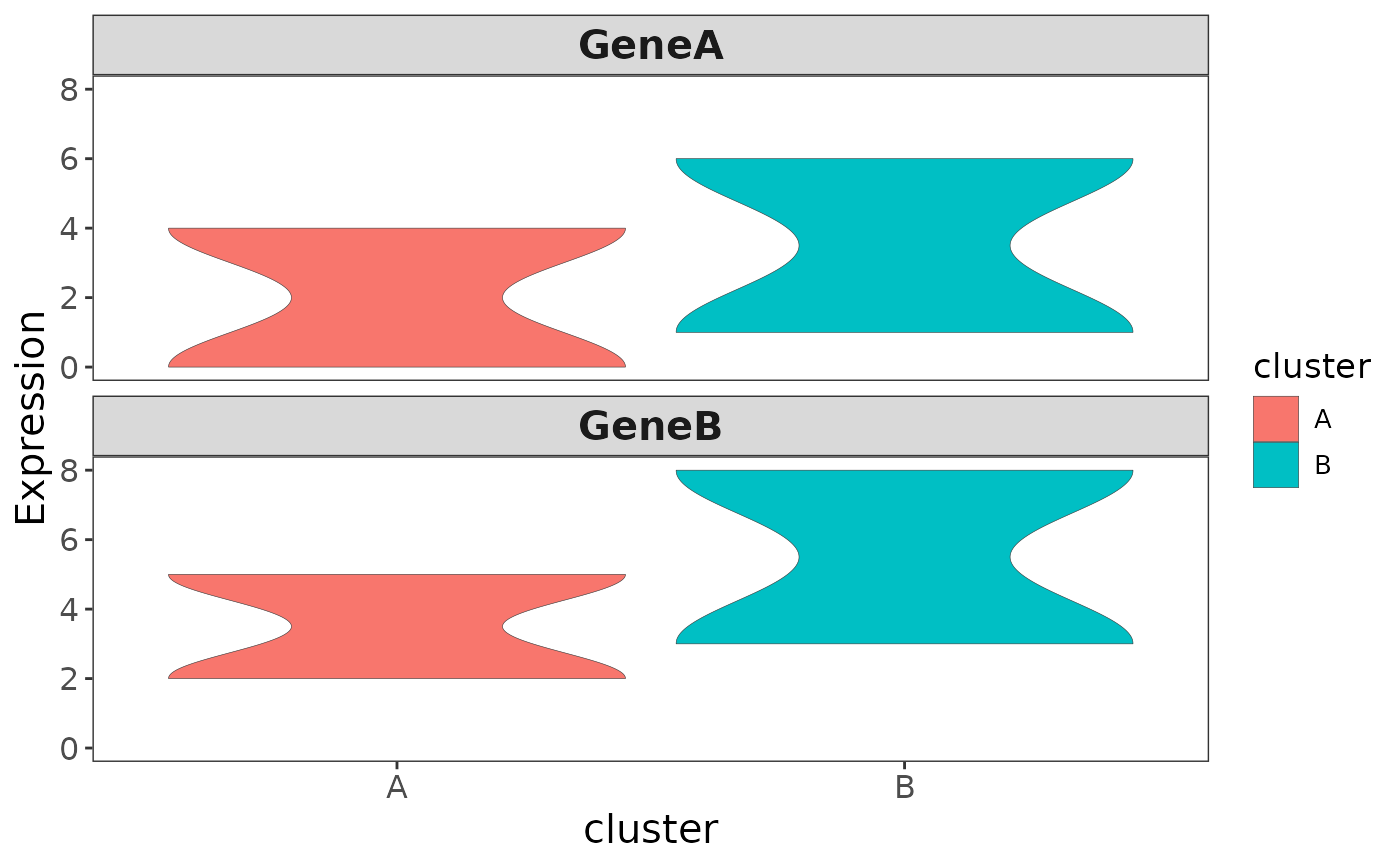
Lightweight reimplementation of violin plot with additional splitting features. This works on just a data frame and does not need to be passed the entire object.
Usage
violin2(
  df,
  xcol,
  ycol,
  color = NULL,
  colors = NULL,
  draw_points = FALSE,
  scales = "fixed",
  text_scale = 1
)
Arguments
- df
data.frame with expression data
- xcol
x-axis grouping column
- ycol
values to show on y-axis
- color
column to split violins by
- colors
vector of colors to use (not used)
- draw_points
show points for each cell? Default: FALSE
- scales
should y-axis be 'fixed' (default) or 'free'
- text_scale
scaling factor for text labels. If < 1, text size is reduced and vice-versa
Examples
df <- data.frame(
  cluster = factor(rep(c("A", "B"), each = 4)),
  variable = rep(c("GeneA", "GeneB"), times = 4),
  value = c(0, 2, 4, 5, 1, 3, 6, 8)
)

violin2(df, xcol = "cluster", ycol = "value")
#> Warning: Using `size` aesthetic for lines was deprecated in ggplot2 3.4.0.
#> ℹ Please use `linewidth` instead.
#> ℹ The deprecated feature was likely used in the cascadeR package.
#>   Please report the issue at <https://github.com/NICHD-BSPC/cascadeR/issues>.