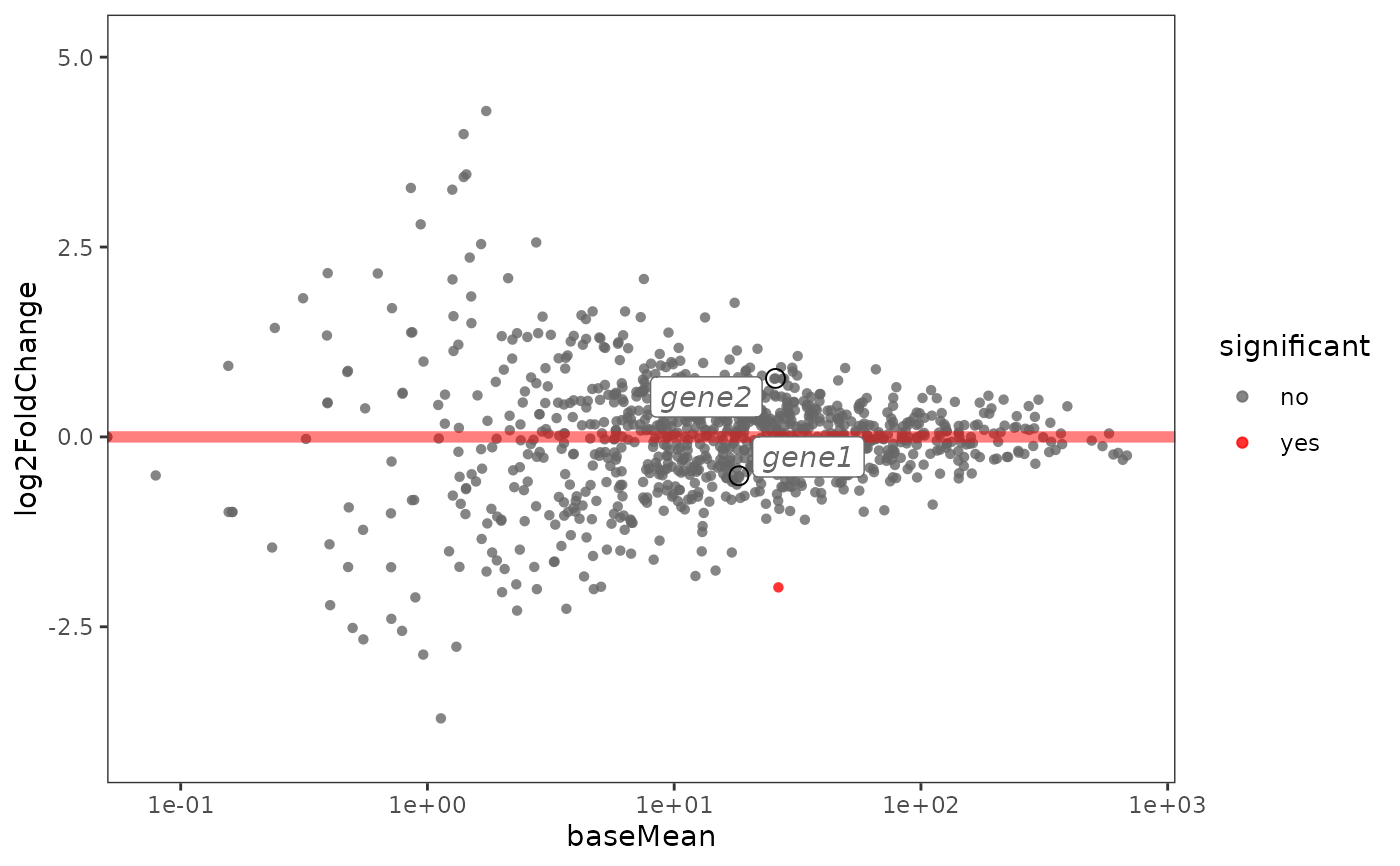
This function creates an MA plot from a data.frame containing DE analysis results.
Usage
plotMA.label(
  res,
  fdr.thres = 0.01,
  fc.thres = 0,
  fc.lim = NULL,
  lab.genes = NULL,
  tolower.cols = c("SYMBOL", "ALIAS")
)Examples
# make mock results df
n_genes <- 100
res <- data.frame(
         baseMean = runif(n_genes, 10, 1000),
         log2FoldChange = rnorm(n_genes, 0, 2),
         lfcSE = runif(n_genes, 0.1, 0.5),
         stat = rnorm(n_genes, 0, 3),
         pvalue = runif(n_genes, 0, 1),
         padj = runif(n_genes, 0, 1),
         symbol = paste0("GENE", 1:n_genes),
         row.names = paste0("gene", 1:n_genes)
       )

plotMA.label(res, lab.genes = c("gene1", "gene2"))